A maturing NCS with many small discoveries, substantial resources in existing fields and still the opportunity for large discoveries
3.4.1 Many discoveries on the NCS, but the average size is decreasing
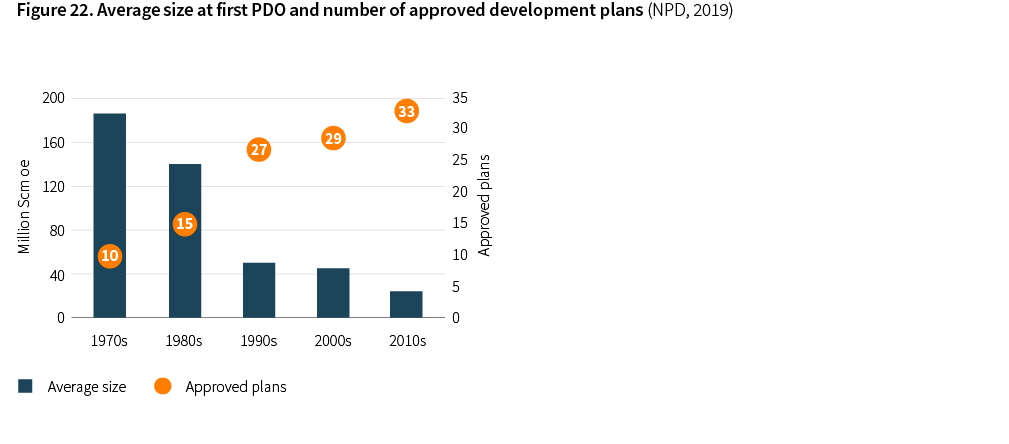
The NCS is maturing, which the average field development size per decade from the 70'ies and until today as shown in Figure 22, clearly indicates. At the same time the average number of field developments per decade has increased (NPD, 2019).
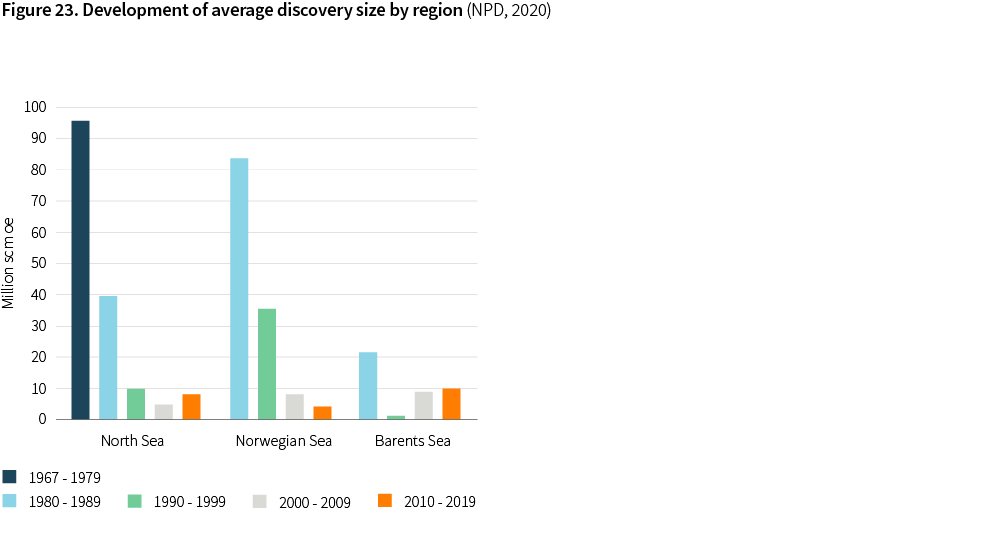
The large fields in the North Sea and the Norwegian Sea were mainly developed during the 70's and 80's, see Figure 23. With a few exceptions, notably the Johan Sverdrup field discovered in 2011, the discoveries and field developments have since then been relatively smaller. The Norwegian part of the Barents Sea is less explored, and a similar creaming curve for that basin is still not observed.
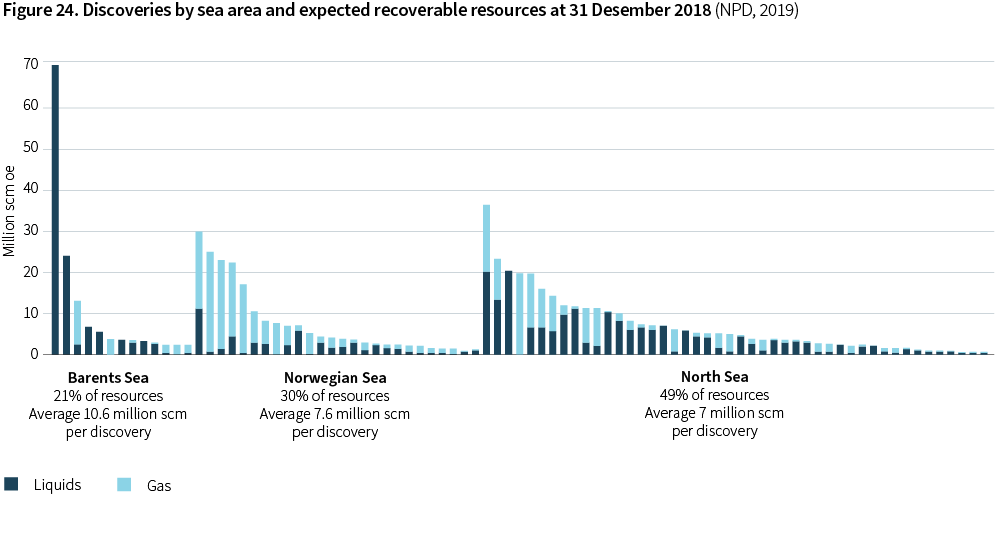
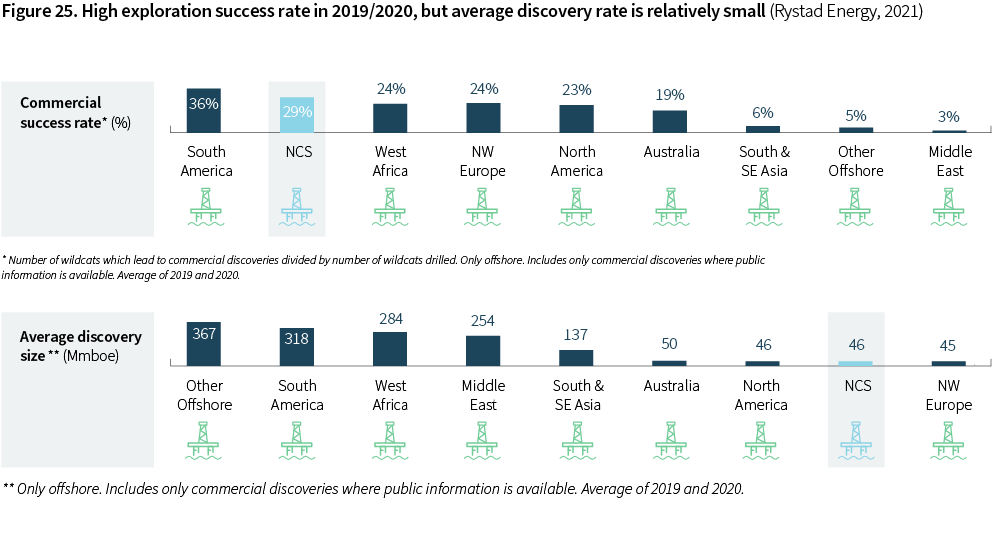
The NCS discovery portfolio in 2018 consisted of 85 discoveries with an average size of 49 million boe (NPD, 2019). The average discovery in 2019 and 2020 was approximately of the same size, see Figure 25. The average discovery on the NCS is small compared to many other provinces in the world, but the exploration success rate is high.
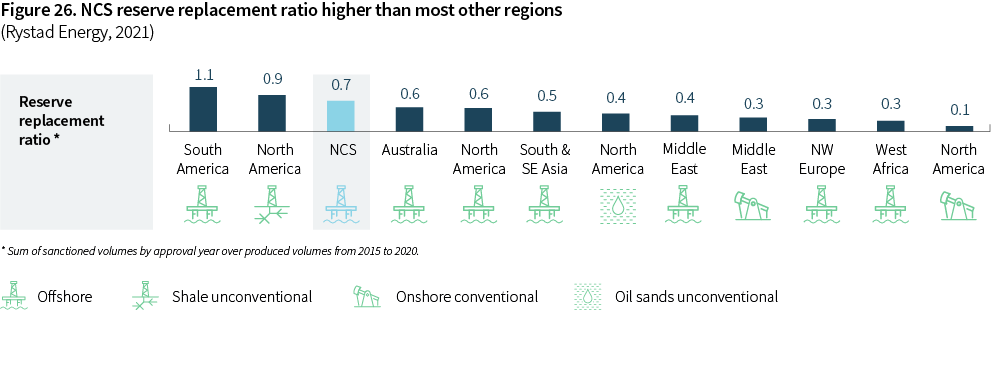
With a reserves replacement ratio (RRR) of 0.7, new discoveries on the NCS have not been able to replace the production over the last 5 years, as Figure 26 shows. In a global context, the RRR is competitive though. The RRR does not reflect reserves growth in existing fields.
3.4.2 Existing infrastructure key to further NCS development
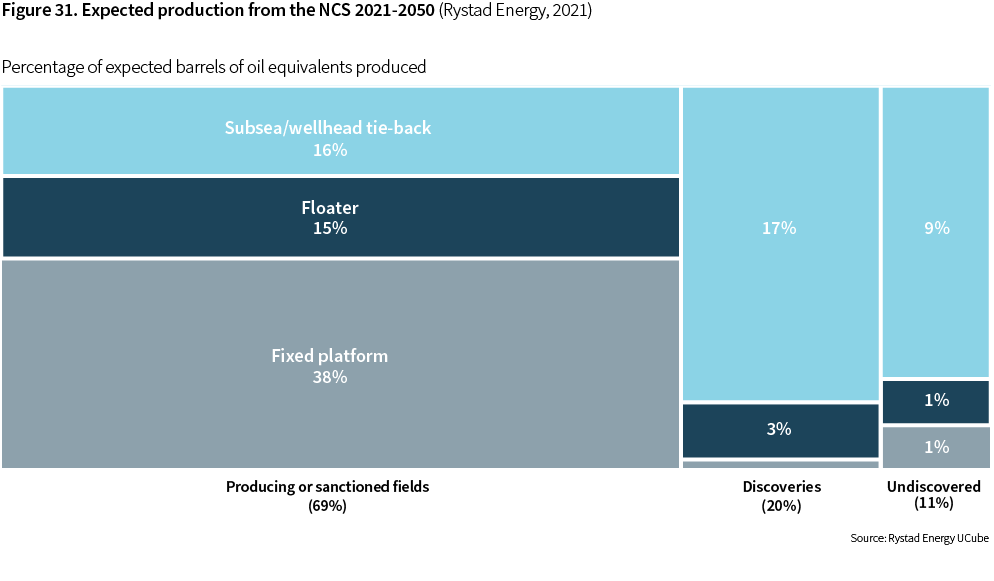
Existing infrastructure is key to the further NCS development:
- Realizing the large contingent resources in existing fields, indicated in Figure 2 in Section 4.
- Realizing the large portfolio of smaller discoveries that would require tie-back to a host.
- It encourages further exploration in the proximity of potential hubs.
Contingent resources in existing fields are of the same magnitude as the contingent resources in the discovery portfolio. Historically, operators in collaboration with suppliers on the NCS have been able to realize such resources with great success.
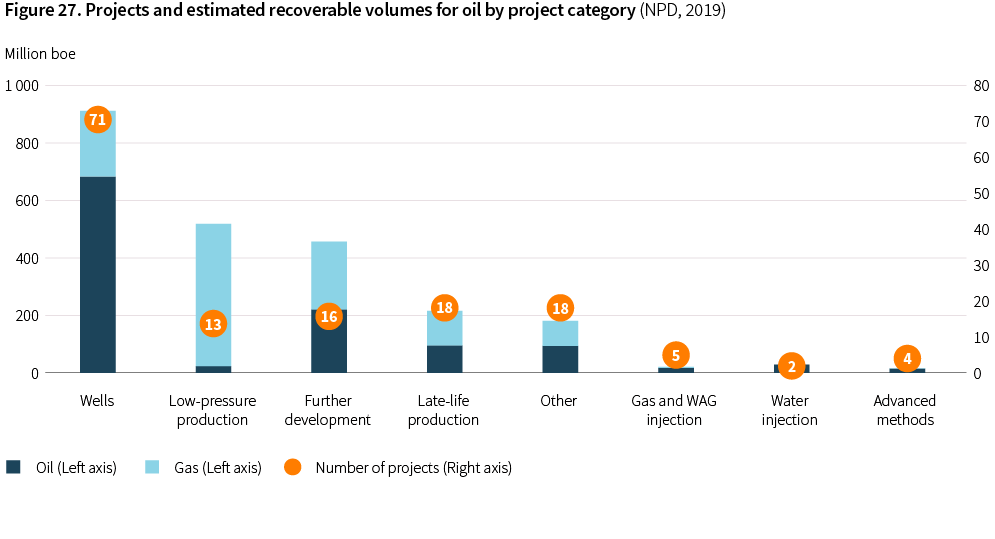
Looking forward, there are numerous projects in the pipeline that would improve oil recovery (IOR) from existing fields – Figure 27 shows specific but undecided projects reported to the NPD. Wells are the most important measure to realize new resources from existing oil fields, whereas low-pressure production is the measure that is favored for gas fields.
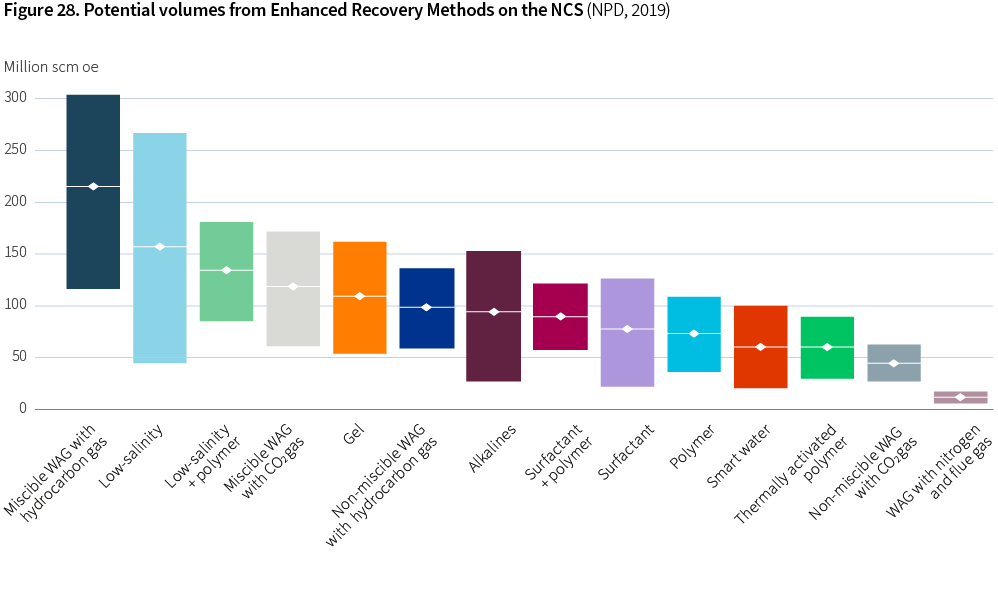
In addition, there is a substantial potential for improved recovery related to more advanced methods, the so-called Enhanced Oil Recovery (EOR) methods, see Figure 28. The figure presents the scaled potential for specific EOR methods summed up for 27 discoveries and fields included in an NPD study on the EOR potential (NPD, 2019). The scaled potential reflects operational criteria as well as economics.
Despite the potential large volumes such measures could provide, there are only few projects currently being considered, as Figure 27 shows.
IOR and EOR methods can provide large added volumes. When it comes to investment decisions, many of the methods fall short because of either high costs and/or high GHG emissions.
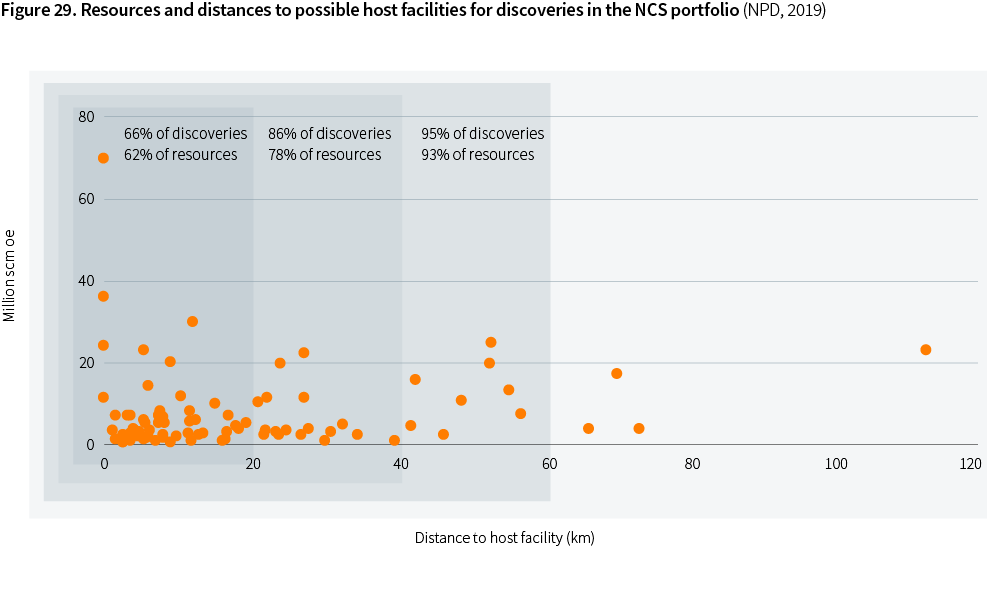
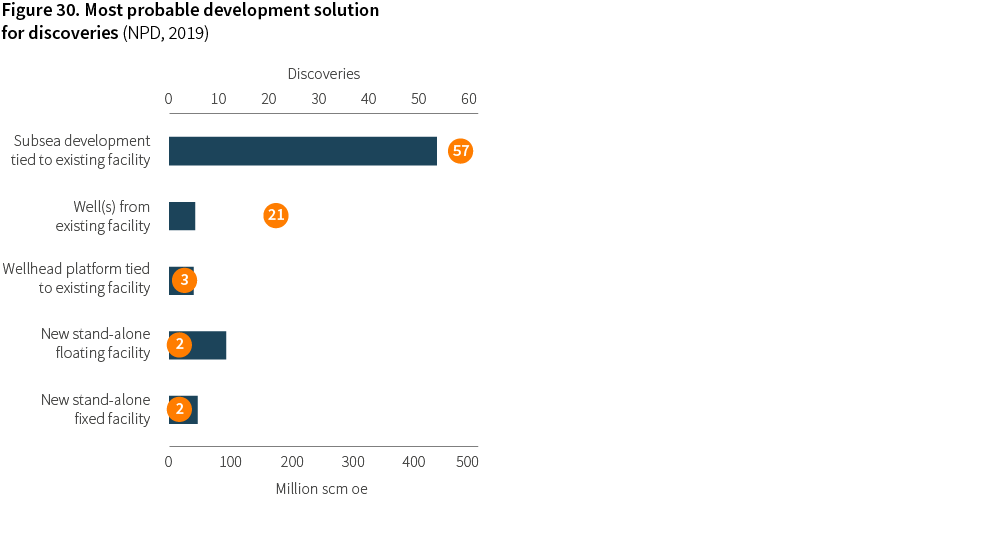
Most of the 85 discoveries in the NCS portfolio are too small to justify stand-alone developments, and would therefore require tie-back to existing infrastructure to become realized, as Figure 29 suggests. 86% of the discoveries are within a 40 km distance to a possible host discovery. Only 4 of the 85 discoveries are further than 60 km away from a potential host facility.
The size distribution of the discoveries and the proximity to potential host facilities, illustrate the importance of efficiently utilizing existing infrastructure for the further development of the NCS (NPD, 2019).
Realizing more resources on the NCS is a cross-functional task involving subsurface, drilling and well, and facilities disciplines, in close collaboration with safety and external environmental groups. This is reflected in the OG21 technology priorities described in Section 4.